Power BI report · Marche, Italy
An eight-page Power BI profile of an Italian region, built on official statistics
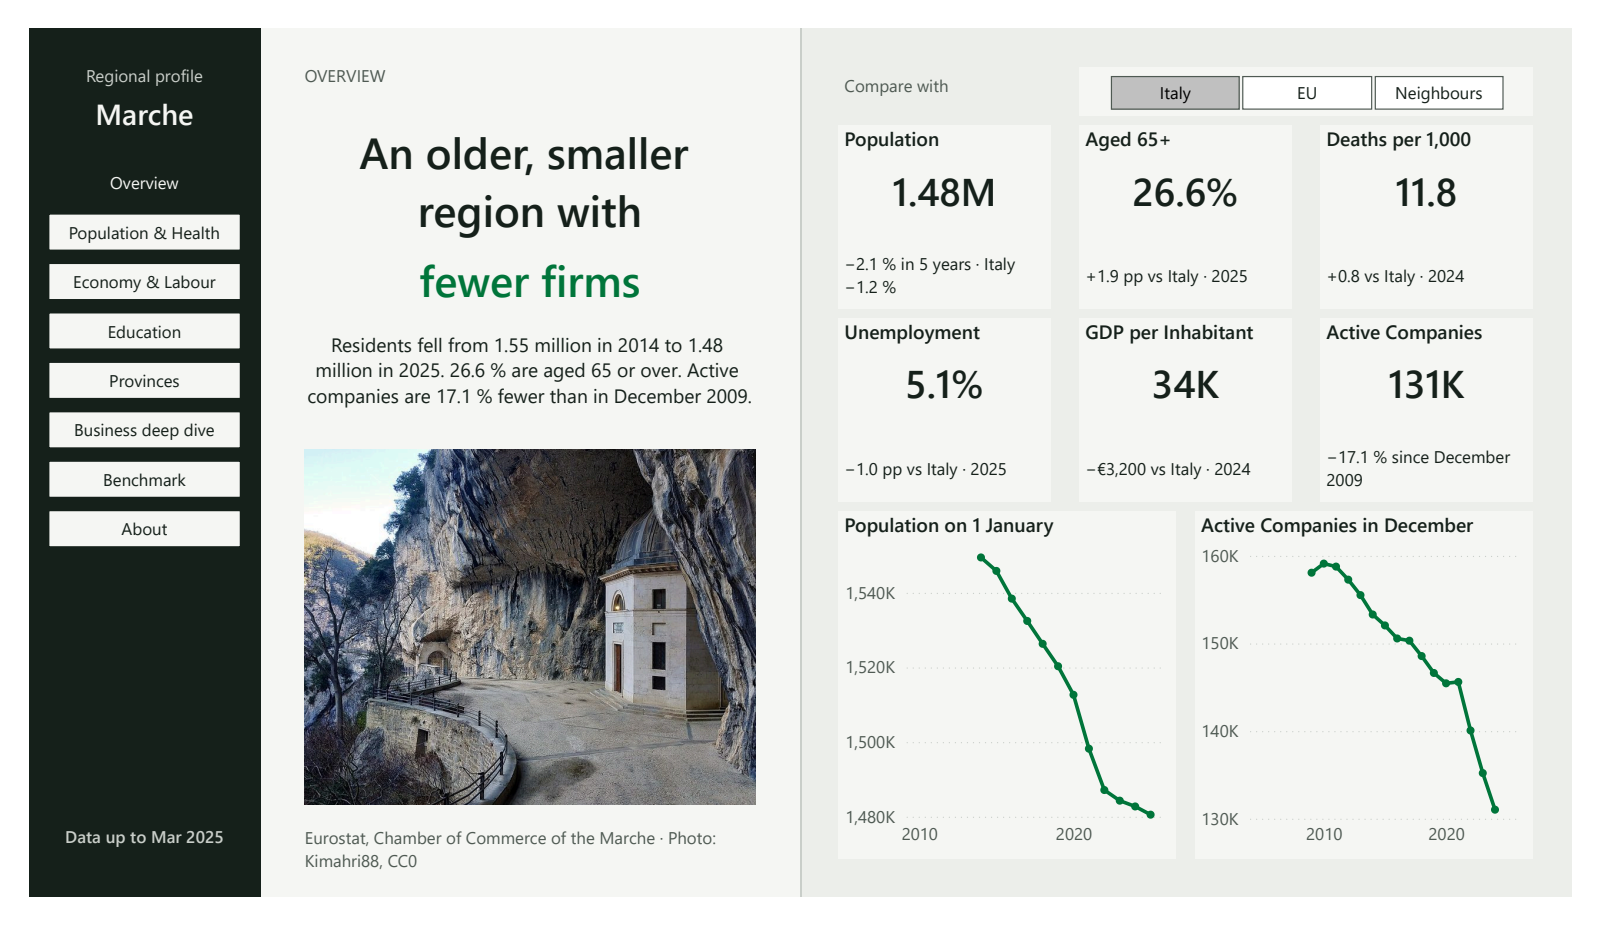
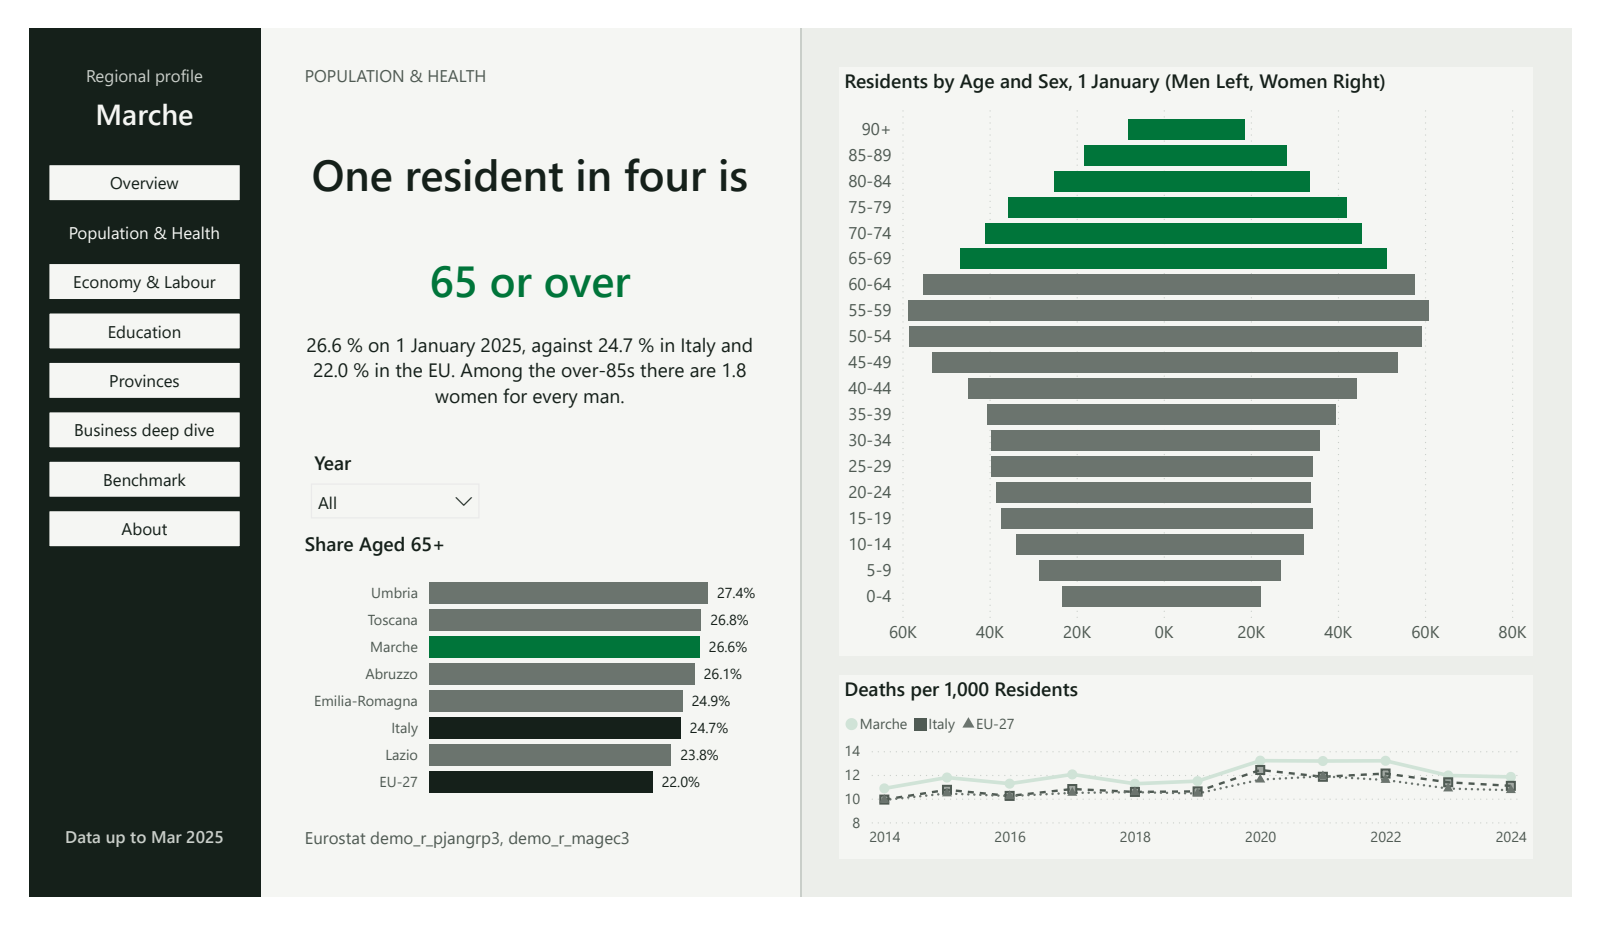
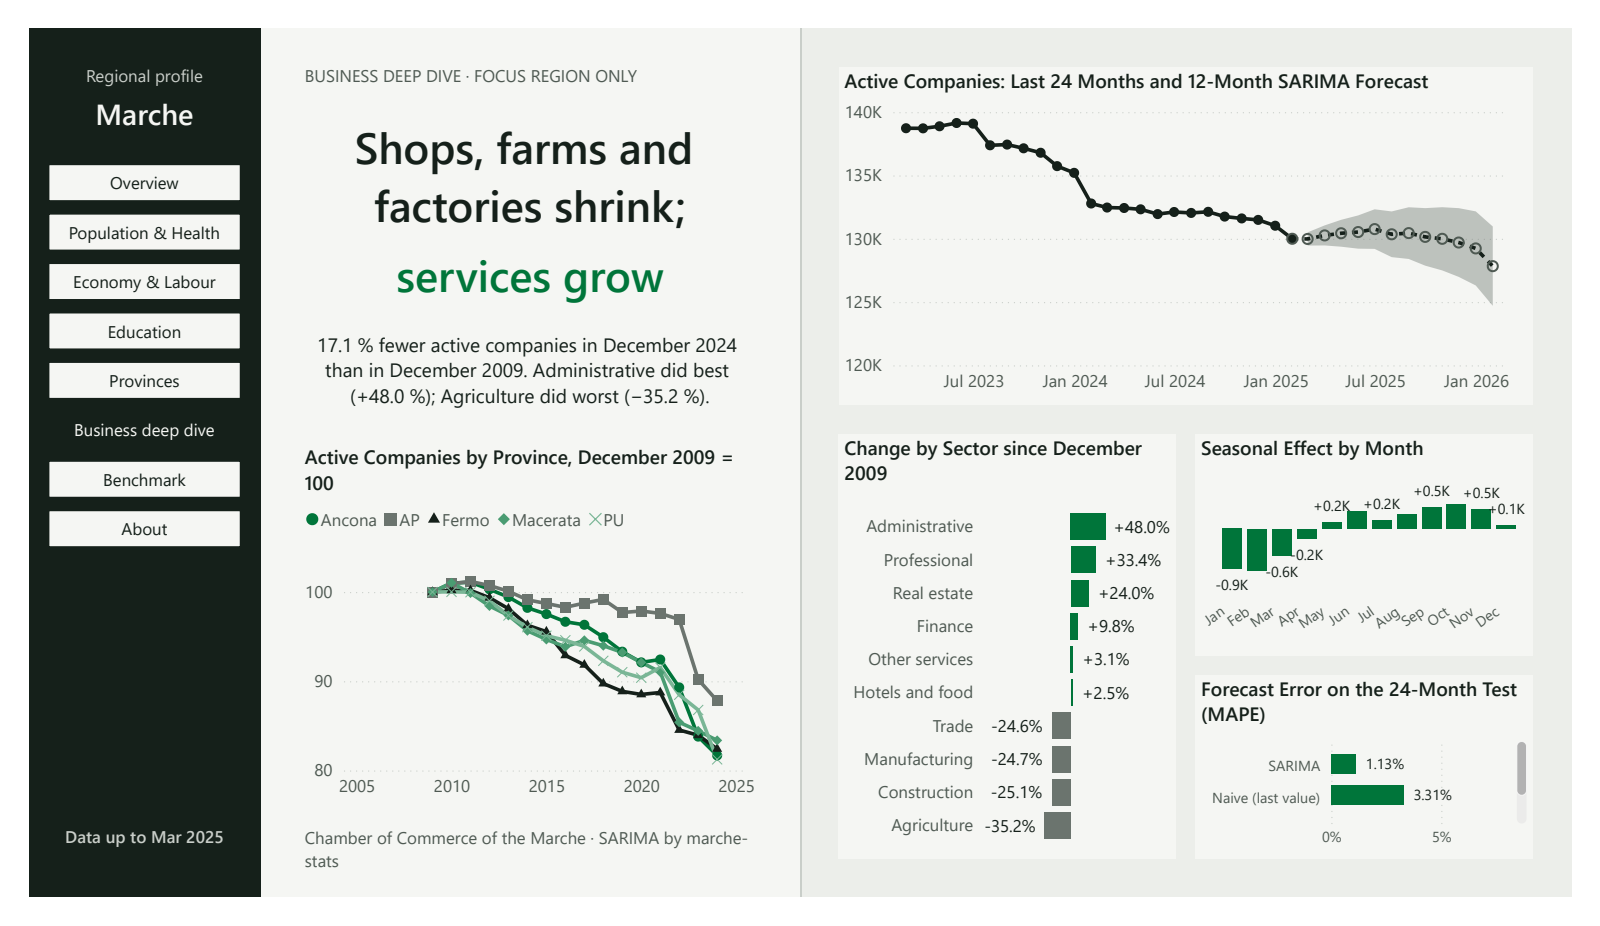
The Marche are an older, smaller region with fewer firms: 26.6 % of residents are aged 65 or over, and active companies are 17.1 % fewer than in December 2009.
What it shows
Numbers that can be trusted
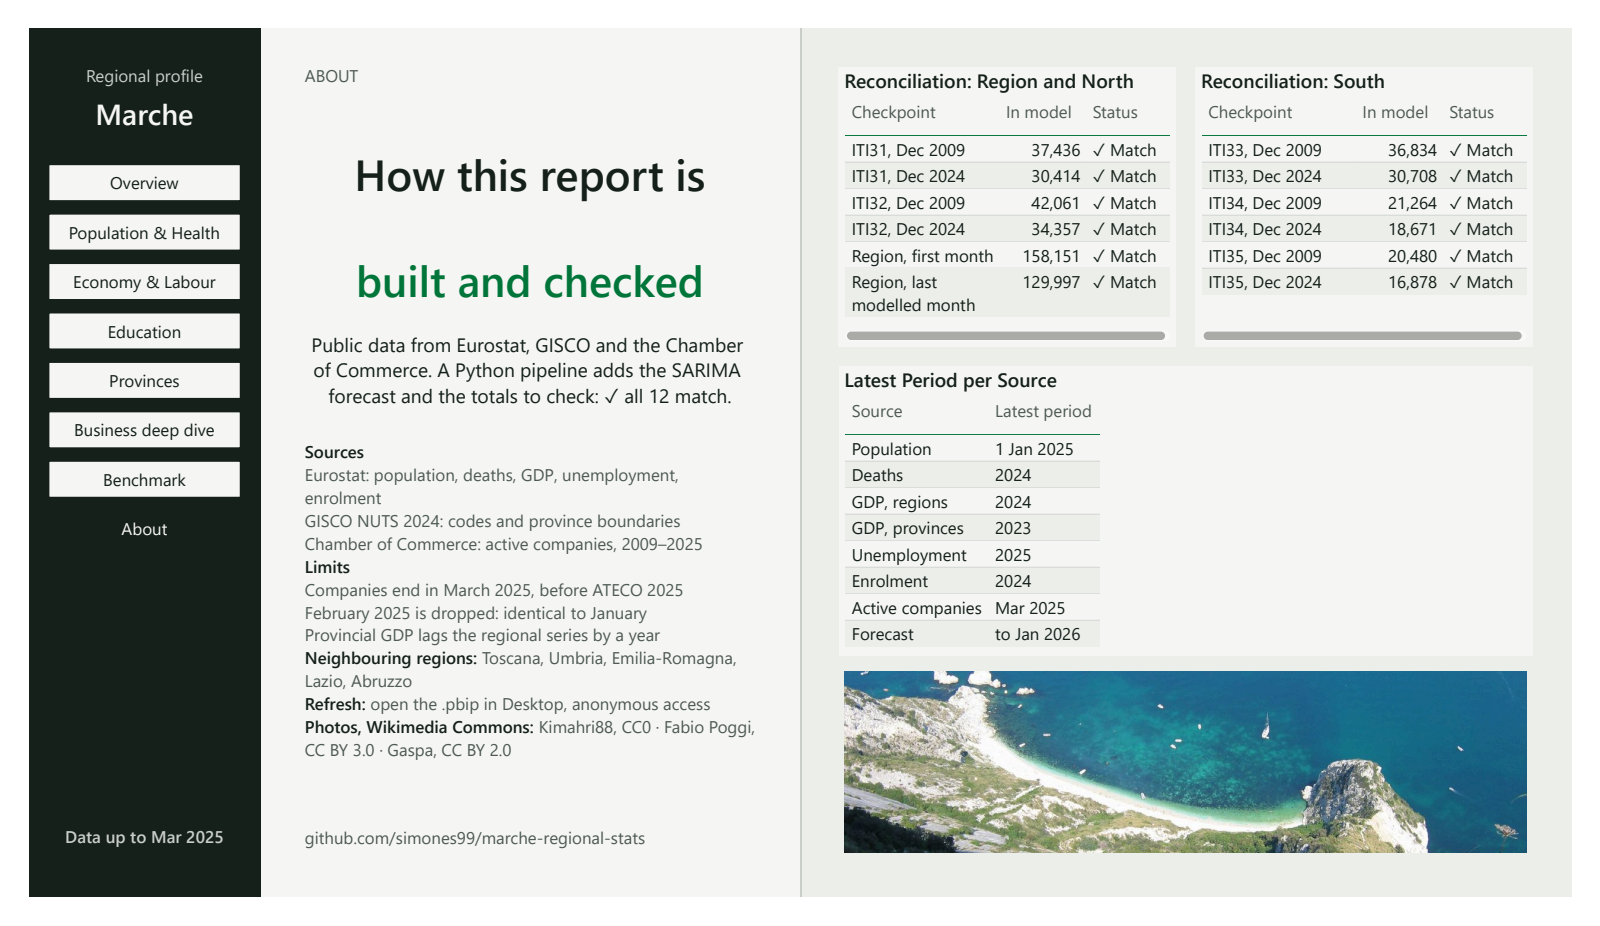
- Checked twice. The company counts in the report match those of an independent Python pipeline at 12 checkpoints, and the report shows the check on its About page.
- Constant boundaries. Nine municipalities moved to Emilia-Romagna in 2010 and 2021. They are left out of every month, so their departure does not look like companies closing.
- Sources watched every week. An automated job requests every source the report uses each Monday, so a changed or missing file is caught before the next refresh.
- A forecast tested fairly. The forecast of active companies is scored on 24 months it never saw: an average error of 1.1 %, against 3.3 % for repeating the last value.
Power BI craft
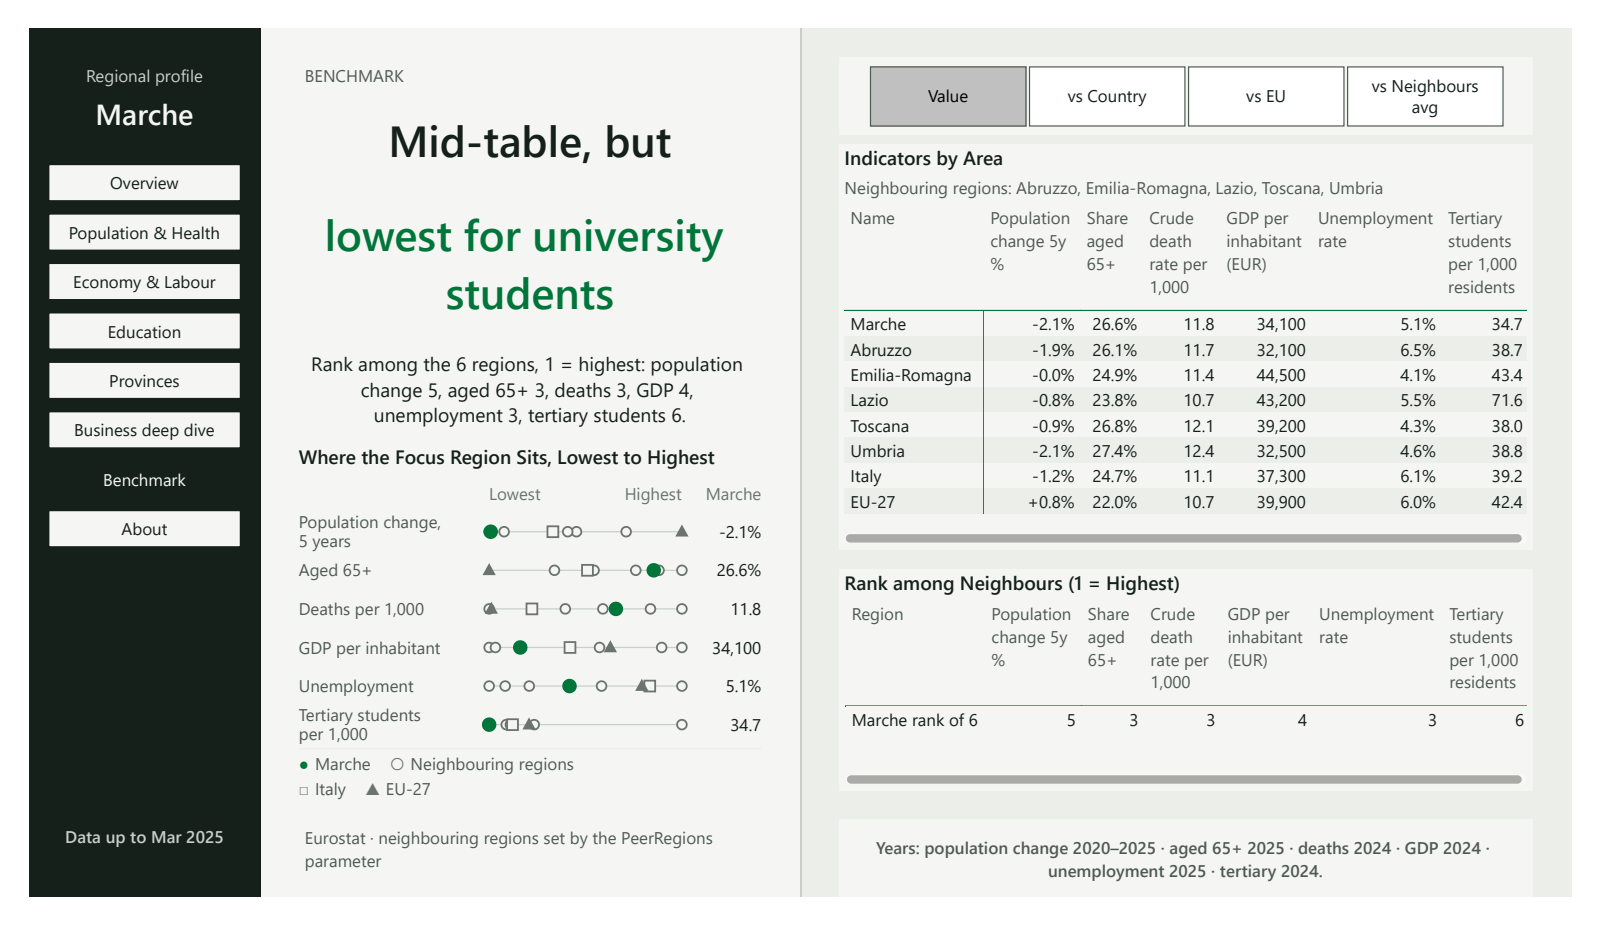
- One model for every comparison. A star schema keyed on the EU's region codes, with a calculation group that compares any indicator with Italy, the EU or the neighbouring regions, and a field parameter that lets one map show five indicators.
- Text written by the data, and checked in CI. Headlines and paragraphs are DAX measures that state a claim only when the numbers support it, and the Best Practice Analyzer checks the model on every pull request.
The eight pages
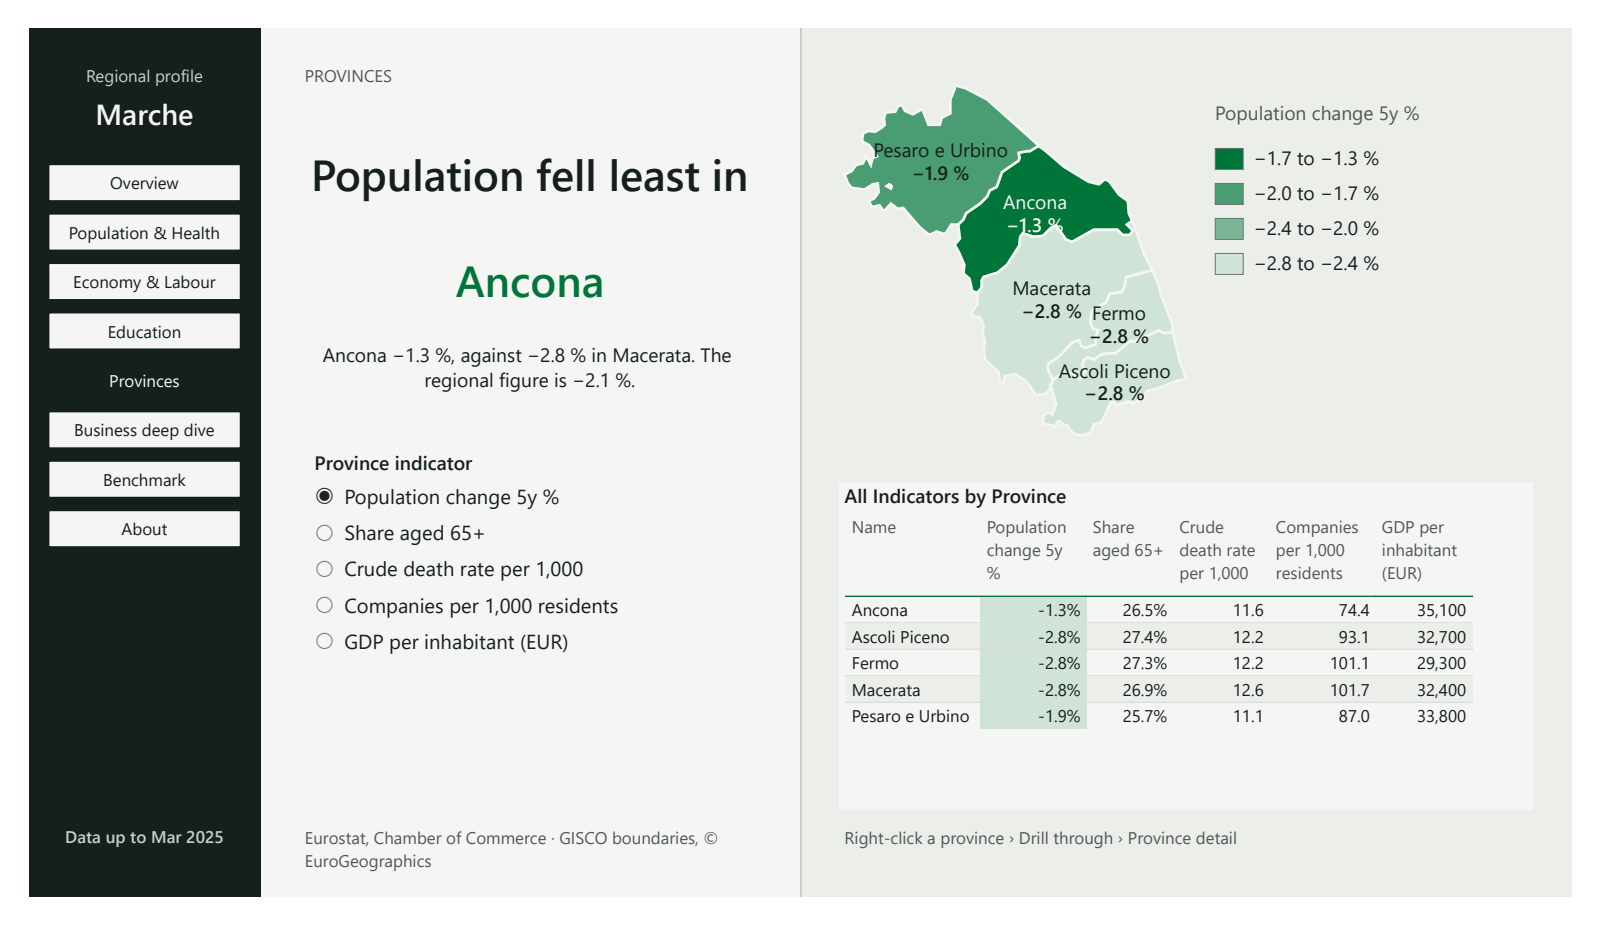
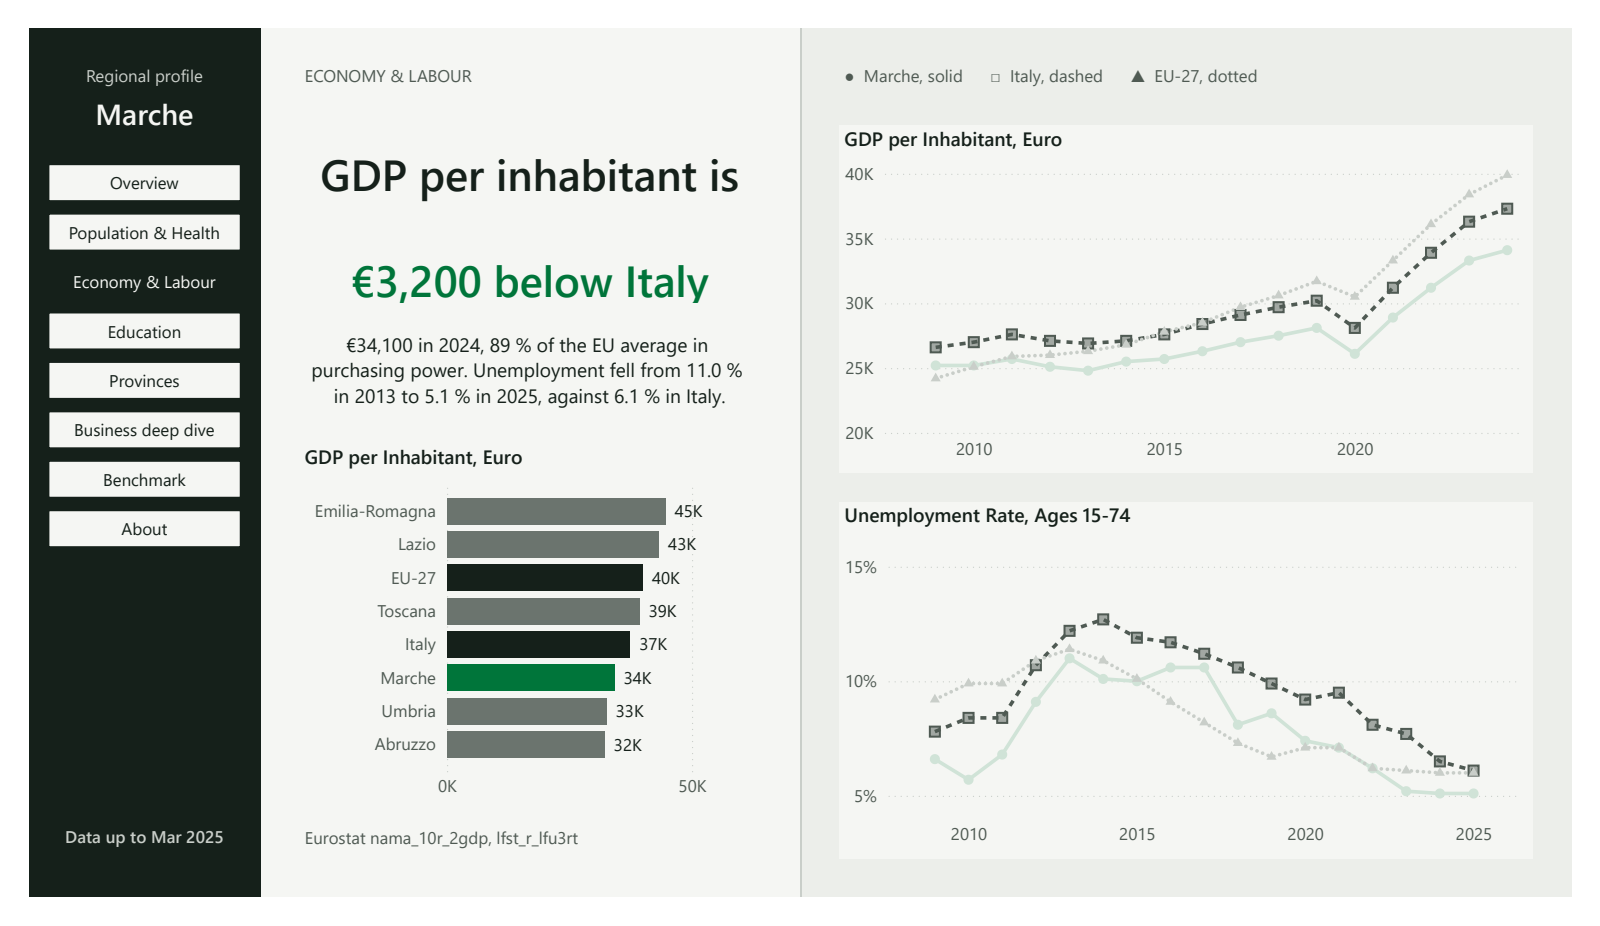
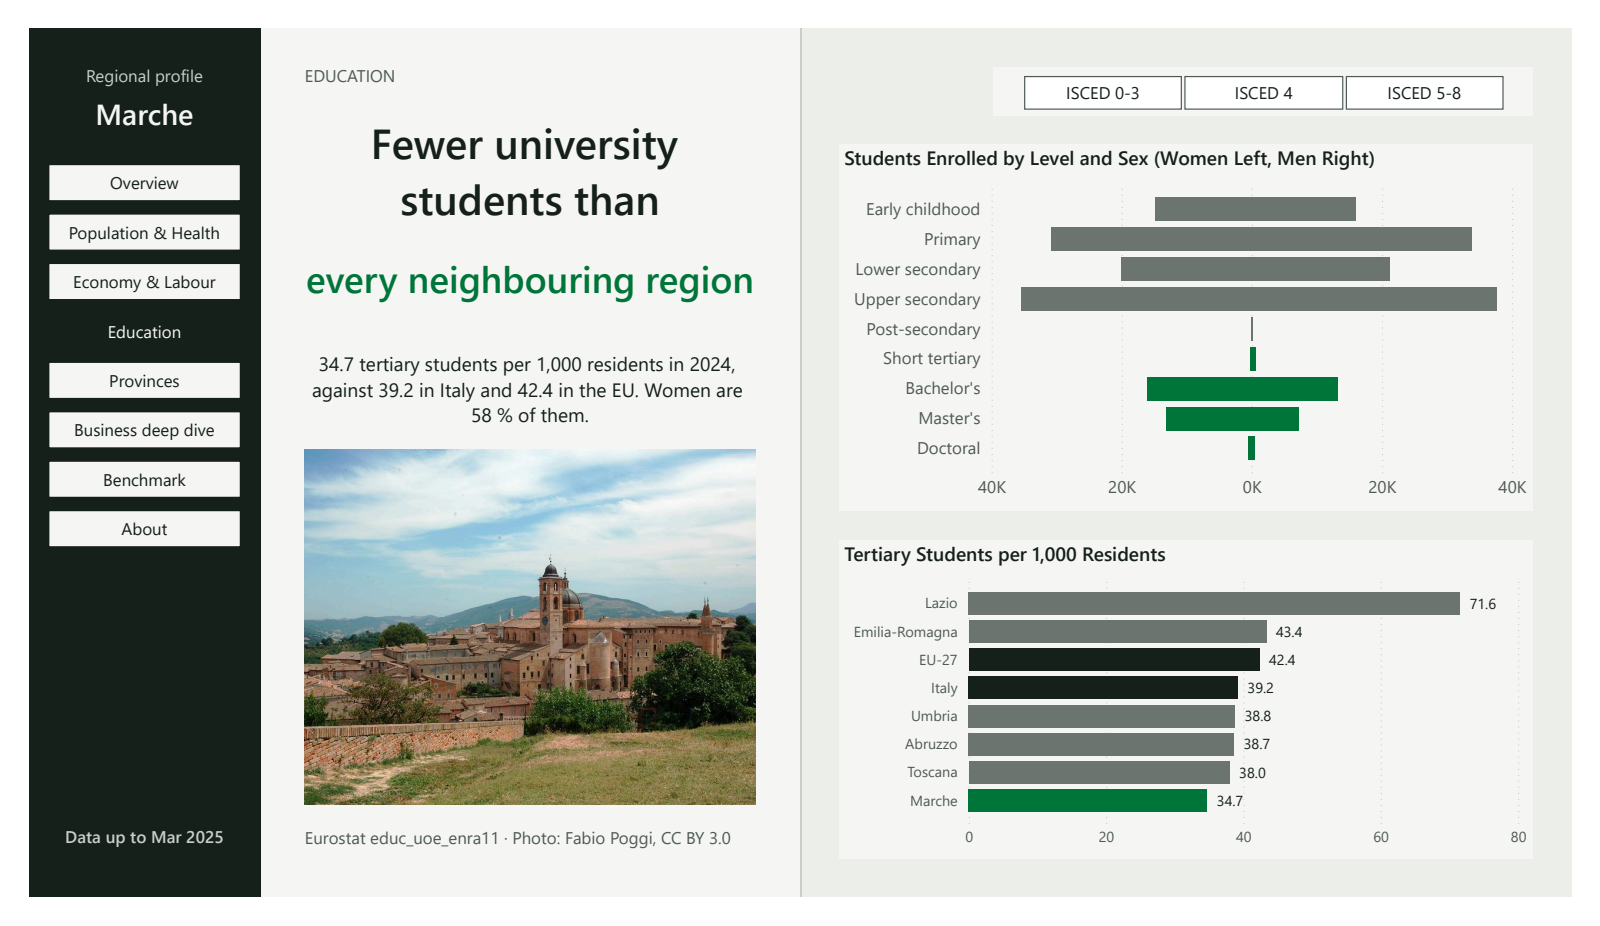
Tap a page or a clip to open it at full size. The clips under Provinces, Business deep dive and Benchmark show the report in use.
How it's built
-
Pipeline
A Python package downloads the business register, removes double counts and moved municipalities, fits the SARIMA forecast and exports the forecast, its accuracy, the check totals and the province outlines as CSV files that Power BI reads from GitHub.
-
Model
Power BI reads Eurostat directly through one reusable Power Query function, and cleans the register with the same rules as the pipeline. Facts and dimensions form a star schema keyed on NUTS codes, with a calculation group for every comparison.
-
Report
Eight pages on one grid, in three colours, with a province drill-through and tooltip pages. The province map is an SVG drawn by a DAX measure, so it needs no map service and survives the PDF export.
-
Checks
Tests on synthetic data and on the model files, and the Best Practice Analyzer, run on every pull request; a weekly job requests every source; the About page reconciles the report with the pipeline.